Why Standard Weather Forecasts Fall Short on the Water
A typical smartphone weather application focuses on ground-level conditions over land, tracking surface air temperatures, daily precipitation odds, and mild inland breezes. On open water, however, friction against the earth disappears, allowing wind systems to build uninterrupted power across vast expanses of open water. Surface water temperatures also interact directly with atmospheric pressure, creating dense maritime fog banks, sudden thermal convection, and sharp wind shifts that never register on city-based meteorological models.
Relying on terrestrial apps for a boating excursion often leaves skippers unprepared for sudden wind shears and dangerous wave building. Marine environments require dedicated maritime weather forecast data that calculates wind friction over water, surface fetch, and localized atmospheric stability. A forecast predicting ten miles per hour over town can easily translate into twenty knots of sustained chop across an unprotected bay just three miles away.
Professional mariners depend on marine weather report summaries generated specifically for defined nautical zones rather than municipal zip codes. These marine reports examine barometric fluctuations, oceanic boundary layers, and air-sea interface physics to produce realistic expectations for surface conditions. Checking these specialized datasets before you depart from an inland slip or a boat launch ramp ensures that you evaluate the actual aquatic environment rather than dry pavement miles away.
Understanding NOAA Marine Forecast Zones and Bulletins
The National Oceanic and Atmospheric Administration divides coastal shorelines, large bays, sounds, and the open ocean into clearly indexed marine forecast zones. Rather than covering broad counties, each zone defines an exact body of water, such as coastal waters out twenty nautical miles or deep offshore waters beyond sixty miles. When you read a noaa marine forecast, your first task is identifying the precise alphanumeric zone code corresponding to your planned route and intended cruising radius.

A standard noaa marine weather report begins with a headline noting any active advisories, followed by a synoptic overview describing the regional pressure systems that govern the general flow. Below this synopsis, the report breaks down chronological windows—typically morning, afternoon, and night for the next five days—listing expected wind direction in cardinal points, sustained wind speed in knots, wave heights in feet, and localized precipitation or visibility restrictions.
Skippers handling private vessels or operating boat rentals on-site must verify whether their route crosses between distinct zones. Passing beyond a protective barrier island or traversing an inlet into open ocean transitions your vessel into a separate forecast sector with entirely different wave energy and wind exposure. Tracking these zone boundaries on coastal charts guarantees you do not inadvertently venture into unsheltered seas without realizing the zone has shifted.
Translating Wind Direction, Knots, and Gust Intervals
Wind reports in nautical environments use knots rather than statute miles per hour, where one knot equals roughly 1.15 land miles per hour. While that difference might appear slight at single digits, a reported maritime forecast of twenty-five knots actually equates to nearly twenty-nine miles per hour on the water. This added velocity dramatically increases the aerodynamic pressure exerted against your boat's hull, cabin structure, and canvas bimini tops.
Directional notation always specifies where the wind originates, meaning a northwest wind blows out of the northwest toward the southeast. This distinction determines where surface fetch develops, which is the uninterrupted distance over water that wind can blow to generate swells. A ten-knot wind blowing off a nearby shoreline leaves the immediate leeward water flat and calm, whereas the exact same wind blowing across twenty miles of open water builds steep, jarring waves.
Marine reports differentiate between sustained wind speeds and intermittent gusts, which indicate the peak velocity mariners must prepare to handle. If a noaa marine weather forecast calls for fifteen knots with gusts up to twenty-five knots, stability calculations must always respect that upper figure. Unexpected gusts induce sudden heel on sailboats, snap dock lines during docking maneuvers, and destabilize light planing powerboats traveling at high cruising speeds.
Evaluating Wave Heights, Swell Direction, and Wave Period
Wave height descriptions in a noaa marine report denote the significant wave height, which represents the average height of the highest one-third of all measured waves. This standard scientific convention means that individual waves within any wave train will frequently measure substantially higher than the listed forecast. Statistically, roughly one in every ten waves will be roughly twenty-five percent taller, and rogue combinations can produce waves nearly twice the posted forecast height.
Height alone does not establish whether sea conditions are comfortable or hazardous; wave period dictates wave steepness and overall vessel safety. The wave period measures the time interval in seconds between two successive wave crests passing a fixed location. Long periods of ten to fourteen seconds indicate smooth, rolling ocean swells that most hulls handle comfortably, whereas short periods of three to five seconds produce tight, steep chop that slams against the bow and threatens boat control.
A reliable rule of thumb among coastal navigators is comparing wave period directly against wave height in feet. When the wave period in seconds matches or drops below the wave height in feet—such as six-foot waves spaced four seconds apart—the sea state turns dangerously steep, increasing the odds of pitch-poling, broaching, or taking heavy green water over the forward bow deck.
Decoding Small Craft Advisories and Severe Marine Warnings
The National Weather Service issues tiered marine warnings to alert boaters to escalating atmospheric dangers across coastal and offshore sectors. The lowest standard threshold is the Small Craft Advisory, which generally signals sustained winds or frequent gusts between twenty and thirty-three knots, or hazardous wave conditions that threaten smaller hulls. What defines a small craft depends on the local region, but it typically encompasses recreational boats under sixty-five feet in length.
When atmospheric systems deepen, NOAA upgrades alerts to Gale Warnings for winds between thirty-four and forty-seven knots, followed by Storm Warnings for sustained winds of forty-eight to sixty-three knots. Above sixty-three knots, forecasters issue Hurricane Force Wind Warnings unless a named tropical cyclone is present, in which case Tropical Storm and Hurricane Warnings take operational precedence across all coastal broadcast frequencies and marine forecast maps.
In addition to sustained wind alerts, meteorologists dispatch Special Marine Warnings for short-duration, high-impact hazards occurring over localized areas. These alerts cover severe squall lines producing wind gusts over thirty-four knots, localized waterspouts, and sudden hailstorms that develop with little advance notice. When a Special Marine Warning sounds on a vessel's radio receiver, operators have mere minutes to secure deck gear, don life jackets, and steer away from the approaching squall front.
Reading Coastal Weather Maps, Isobars, and Frontal Boundaries
A synoptic coastal weather map provides a comprehensive visual overview of regional pressure distributions, wind vectors, and advancing air masses. The concentric curved lines on these charts, known as isobars, connect points of equal barometric pressure across oceanic and continental territory. When isobars are spaced wide apart, the pressure gradient remains gentle, resulting in mild, predictable winds; closely packed isobars signal a steep pressure gradient capable of generating violent winds.
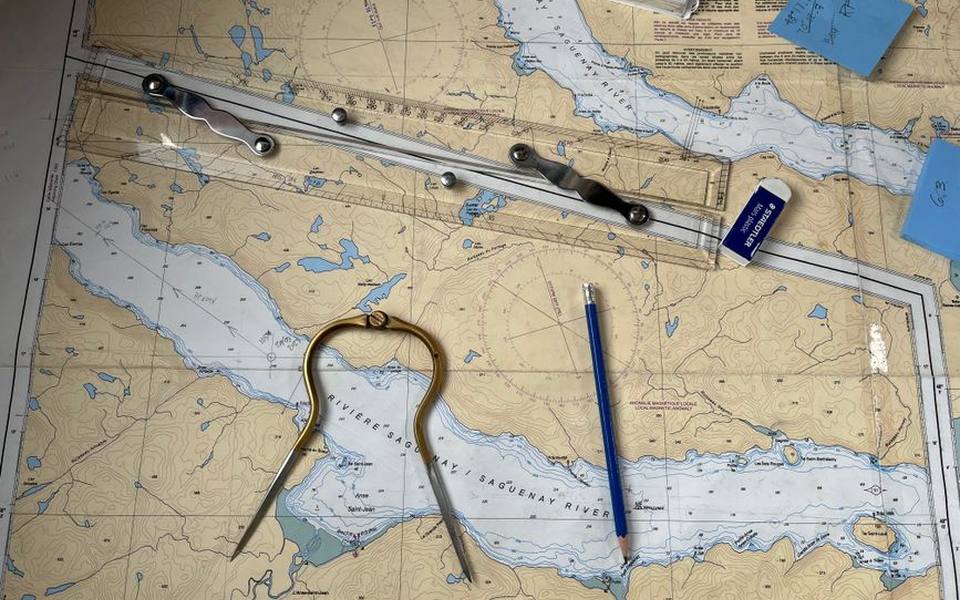
Cold fronts appear as solid lines with triangles pointing in their direction of travel, while warm fronts feature half-circles along their forward boundary. Cold fronts moving over open water frequently spawn rapid wind shifts of ninety to one hundred and eighty degrees within minutes of crossing. As cooler, denser air displaces warm maritime moisture, violent squall lines and downbursts frequently line the leading frontal edge, drastically reducing visibility and overturning unballasted craft.
Studying these visual maps helps skippers monitor barometric trends well before setting out on the water. A sharp drop in barometric pressure, measured in millibars or inches of mercury, almost universally indicates the rapid approach of low-pressure storm systems. Comparing radar reflectivity overlays alongside surface pressure charts lets boaters identify precipitation intensity, embedded thunderstorm cells, and shelf clouds that might disrupt coastal navigation or harbor maneuvering.
Wind Against Current and Dangerous Inlet Hydraulics
Even when an official maritime weather forecast predicts moderate wind speeds, localized hydrological interactions can create severe turbulence at river mouths and harbor inlets. The phenomenon known as wind-against-tide or wind-against-current occurs when surface winds blow directly opposite the direction of an outgoing ebb flow. As flowing water pushes against incoming wind-driven waves, the wave energy compresses horizontally, forcing the waves to stand straight up into steep, breaking walls of white water.
Inlets bounded by shallow sandbars or protective stone jetties amplify these hydraulic forces exponentially during mid-tide cycles. A four-foot sea state out in open water can compress into an eight-foot standing wave pattern across an inlet bar when a hard ebb current collides with onshore winds. Boaters attempting to transit through such channels face severe risk of losing steering control, swamping open cockpits, or bottoming out between successive wave troughs.
Accurate passage planning requires cross-referencing your noaa boating weather reports with local tidal current tables. If a strong opposing wind is forecast during the peak hours of an outgoing tide, experienced skippers delay their departure until slack water or until the flood tide turns in the same direction as the wind. Respecting these localized current transitions prevents traumatic encounters with breaking waves that do not show up on broad regional weather summaries.
Regional Weather Realities Across American Waters
Marine environments exhibit wildly divergent meteorological traits depending on the specific coastline or basin you explore. In southern latitudes, such as around the expansive network of marinas in Florida, afternoon sea breezes reliably spawn intense, localized convective thunderstorms with severe lightning and sudden thirty-knot downbursts, even on days with otherwise benign synoptic forecasts.
Further north along the mid-Atlantic and Northeast, mariners navigate thick sea fogs caused by warm, moist air drifting over chilly oceanic currents, combined with powerful nor'easter low-pressure systems. Inland waterways present entirely distinct challenges; for instance, the vast waters surrounding marinas in Michigan lack oceanic salt density and tidal pull, which allows steep, square freshwater waves to develop with terrifying speed whenever cold polar fronts sweep over the Great Lakes basin.
Along the Pacific coastline, mariners face heavy oceanic swells originating thousands of miles away in the Gulf of Alaska, paired with dense coastal upwelling fogs that obscure headlands. Because water temperatures remain cold throughout the year in these northern waters, capsizing or swamping carries immediate hypothermia risks. Tailoring your preparation to the distinct maritime tendencies of your home cruising grounds ensures you interpret every official marine weather report through a realistic regional lens.
Onboard Weather Monitoring Tools and Real-Time Buoy Data
Relying solely on a morning forecast before casting off lines is never sufficient for safe maritime navigation; atmospheric conditions evolve continuously throughout the day. Modern boaters possess powerful real-time tools to track live conditions, beginning with the continuous VHF marine weather broadcasts managed by the National Weather Service. These automated broadcasts transmit localized forecasts, buoy readings, and emergency warnings across high-band VHF channels 1 through 7 around the clock.
The National Data Buoy Center maintains hundreds of offshore and coastal automated weather buoys that feed direct measurements into public marine networks. By accessing these buoys via satellite communicators or marine apps, skippers can check actual observed wind speeds, maximum gust intervals, air and water temperatures, and wave energy spectra in real time. If a buoy ten miles upwind records winds jumping from ten to twenty-five knots, you receive immediate tactical advance notice of incoming squalls.
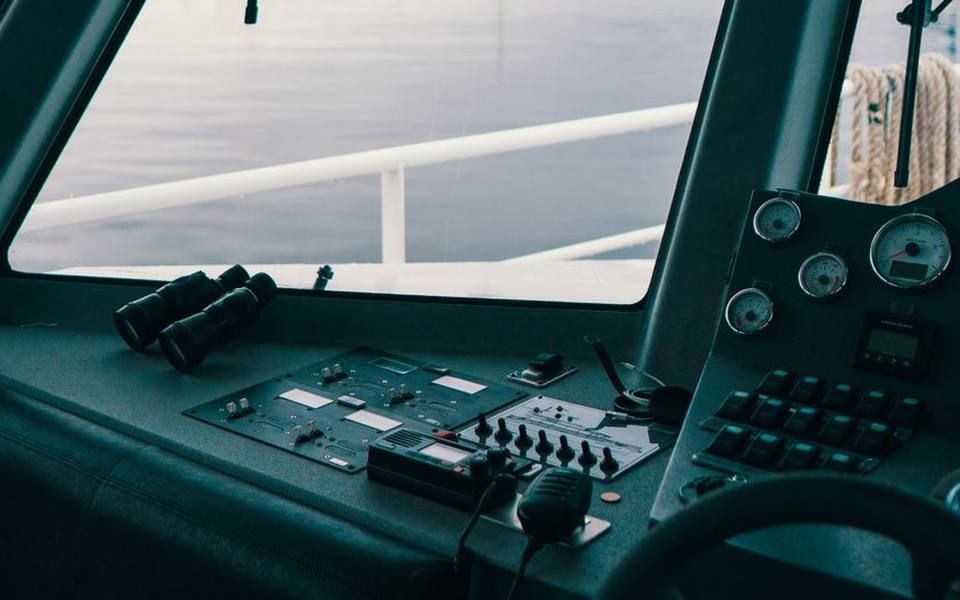
Analog instruments mounted on your vessel's helm console, particularly a mechanical or digital barometer, offer invaluable supplementary safety data. A steady barometric needle generally confirms settled conditions, whereas a rapid drop of two or three millibars within an hour signals an approaching squall or deep frontal line. Observing these real-time instruments while underway allows you to turn back toward safe harbor long before dangerous conditions develop on the surrounding surface.
Setting Personal Minimums and Building a Departure Checklist
A safe day on the water concludes long before departure by establishing firm personal weather minimums tailored to your hull size, crew experience, and comfort level. While a thirty-foot offshore center console might easily handle twenty knots of wind and four-foot swells, that same sea state will overwhelm a twenty-foot bowrider or family deck boat. Defining absolute limits for maximum sustained wind, gust velocity, and wave steepness removes emotional hesitation when deciding whether to cancel a trip.
Every pre-voyage checklist should incorporate a structured review of the primary noaa maritime weather forecast, tidal current flow predictions, and active regional radar overlays. Share your planned route and estimated time of return with a reliable contact ashore by filing a formal float plan. If your voyage spans multiple days or explores remote coastlines, locate potential intermediate anchorages and verify marinas with transient slips along your path where your vessel can seek refuge if weather deteriorates.
The most crucial safety skill any boat captain develops is the absolute willingness to stay tied to the dock when atmospheric conditions look uncertain. Pressure to keep a vacation schedule or fulfill social expectations often leads boaters into hazardous waters that their vessels cannot safely navigate. Respecting the power of coastal weather systems and trusting conservative forecast assessments guarantees that every voyage remains a safe, controlled, and enjoyable marine adventure.
Published 2026-09-21 · reviewed with each rebuild, last September 2026.
Find marinas near you
The directory lists 7,144 marinas by state and city — pick your state or use the “Near me” button in the header.
More guides
-
 Safety
Boat Fire Extinguisher Inspection: Schedule, Checklist, and Costs
-
 Money
MoneyBoat Club Membership Costs: Initiation Fees, Monthly Dues, and Ownership Comparison
-
 Storage
Boat Winterization and Storage: Costs, Checklist, and Shrink Wrapping Guide
-
 Storage
Boat Slips and Docking Fees: How Much Does It Cost to Keep a Boat in the Water?
-
 Owning
Essential Nautical Terms and Practical Boating Knowledge: From the Helm to Harbor Life
-
 Owning
A Practical Guide to Boat Mooring: Buoys, Lines, and Technique
-
 Safety
Essential Boat Safety Gear, Marine Electronics, and Equipment Guide
-
 Service
Outboard Engine Service and Rebuild Costs: What Boat Owners Should Expect to Pay
-
 Safety
Boating Safety Certification and Licensing: State Requirements and Exam Prep
-
 Service
Saltwater and Freshwater Fishing Charters: Choosing Inshore, Offshore, and Deep Sea Trips
-
 Owning
Bareboat Yacht Charters: How to Rent, Qualifications, and Cruising Preparation
-
 Buying
Pontoon & Tritoon Boats: Buying, Renting, Models, and Pricing Guide
-
 Owning
Holiday Boat Parades and Coastal Festivals: Viewing Guide and Schedules
-
 Buying
A Complete Guide to Buying Used Boats: Valuations, Inspections, and Registration
-
 Owning
Waterfront Dining and Dockside Restaurants: Boater's Guide to Dock and Dine
-
 Owning
Dockside Bait Systems, Live Bait Sourcing, and Fish Cleaning Station Setup
-
 Safety
Marine Fire Safety Inspection and Extinguisher Maintenance
-
 Storage
Complete Guide to Boat Winterization, Shrink Wrapping, and Storage Covers
-
 Buying
Electric Boat Motors and Trolling Systems: The Practical Conversion Guide
-
 Owning
A Practical Guide to Public Boat Launches, Kayak Ramps, and Water Access
-
 Owning
Marine Lithium Batteries vs AGM: Setup, Charging, and Performance
-
Service
Boat Fiberglass & Gelcoat Repair Guide: Fixing Cracks, Blisters & Scratches
-
Service
Marine Fuel Tank Cleaning and Rust Removal Guide
-
Safety
USCG Captain's License Guide: OUPV 6-Pack Requirements and Renewal
-
Buying
Boat Dinghies and Inflatables Guide: Types, Motors, and Selection
-
Service
Boat Towing Services and Marine Assistance Memberships Explained
-
Owning
Boat Lettering, Registration Numbers, and Custom Vinyl Decals
-
Service
Outboard Motor and Lower Unit Maintenance, Repair, and Marine Diesel Guide
-
Buying
Shallow Water Anchor Systems: Power-Pole vs. Minn Kota Talon & Raptor
-
 Service
Complete Guide to Marine Bottom Paint and Antifouling Application
-
Owning
Cruising America's Great Loop: Route Planning, Boat Choice, and Cruising Resources
-
Service
Boat and Fishing Charters: Complete Guide to Styles, Rates, and Booking
-
Buying
Personal Watercraft and Jet Ski Guide: Models, Rentals, and Buying
-
 Owning
Marine Supply Stores and Chandleries: Outfitting Your Boat
-
Safety
Marine Weather Forecasts and NOAA Wave Reports: A Practical Boater's Guide
-
Safety
USCG Boat Registration, Boater Education, and Navigational Safety Rules
-
Owning
Marine Lithium Batteries, Solar Panel Systems, and Trickle Charging Guide
-
Service
Boat Trailer Maintenance: Bearings, Replacement Kits, and Towing Prep
-
Safety
Marine VHF Radio Frequencies, Channels, and Electronics Setup
-
 Service
Complete Boat Hull Maintenance Guide: Washing, Acid Cleaners, Gelcoat Repair, and Antifouling Paint
-
Service
Fixing Inflatable Boat Leaks and Replacing Worn Bimini Top Canvas
-
Owning
Buoy Mooring Setup, Dock Lines, Cleat Hitch Knots, and Anchor Pins
-
 Owning
Boat Trim Tabs Guide: Lenco, Zipwake, Bennett, and Electric vs Hydraulic
-
Owning
Upgrading Boat Swim Platforms, Boarding Ladders, and Marine Vinyl Seating
-
Owning
Best Gifts for Boaters, Practical Marine Accessories, and Kayak Storage Racks